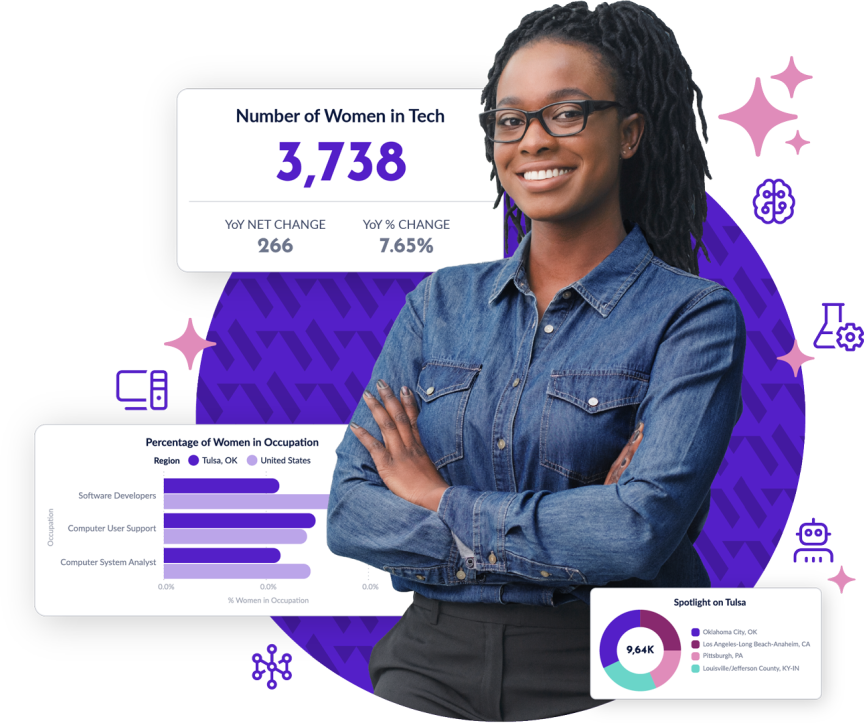

State of Women in Technology in Tulsa examines women's participation in Tulsa's technology workforce, from the labor market data to the education pipeline to the structural barriers that shape who enters technical careers and who advances within them.
The findings are designed to inform the full range of stakeholders working to strengthen Tulsa's technology economy: funders and policymakers setting priorities, employers and workforce partners building pipelines, advocates making the case for change, and community members who want to understand where Tulsa stands and what progress looks like.
The following figures reflect women's participation in Tulsa's technology workforce in 2024, based on Bureau of Labor Statistics occupational employment data.
Net change
YoY % growth
Women employed in technology occupations in the Tulsa region
Up from 27% in
Share of Tulsa's technology workforce that is women Slightly above the national average
The national rate is 1.27%, a gap of nearly
Share of Tulsa's female population working in a technology occupation
Women's tech employment grew 47% over this period, compared to 27% for men
Share of Tulsa's net tech workforce growth driven by women between 2019 and 2024
Net change
YoY % growth
Women employed in technology occupations in the Tulsa region
Up from 27% in
Share of Tulsa's technology workforce that is women Slightly above the national average
The national rate is 1.27%, a gap of nearly
Share of Tulsa's female population working in a technology occupation
Women's tech employment grew 47% over this period, compared to 27% for men
Share of Tulsa's net tech workforce growth driven by women between 2019 and 2024
State of Women in Technology in Tulsa brings the data behind this report to life through an interactive, user-friendly experience. Explore women’s participation in Tulsa’s technology workforce over time by occupation, age group, and other key characteristics, and compare Tulsa’s progress with peer regions across the country. Whether you’re looking to better understand workforce trends, identify opportunities, or inform strategy, the dashboard provides flexible tools to explore the data and uncover insights most relevant to your work.
Use the filters on the top to customize your view by geography, occupation, year, age group, and other dimensions. Hover over charts to view additional details, click chart elements to cross-filter the dashboard, and use the reset button at any time to return to the default view.
In this section you can view top industries over time.
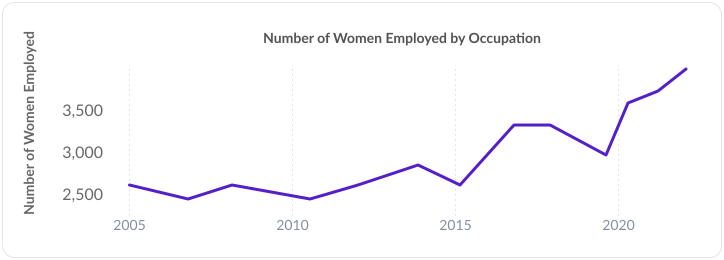
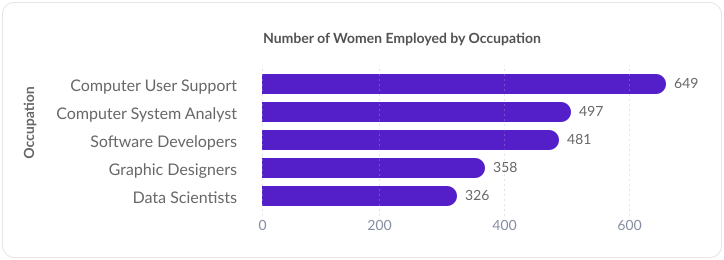
The State of Women in Technology in Tulsa provides a comprehensive analysis of the region’s technology talent pipeline, examining workforce representation, educational pathways, occupational segregation, and the structural factors influencing women’s participation in Tulsa’s technology economy. Beyond documenting current trends, the report identifies key opportunities to expand the region’s technology workforce and outlines three strategic priorities for employers, educators, policymakers, and community leaders working to build a stronger, more inclusive technology ecosystem.
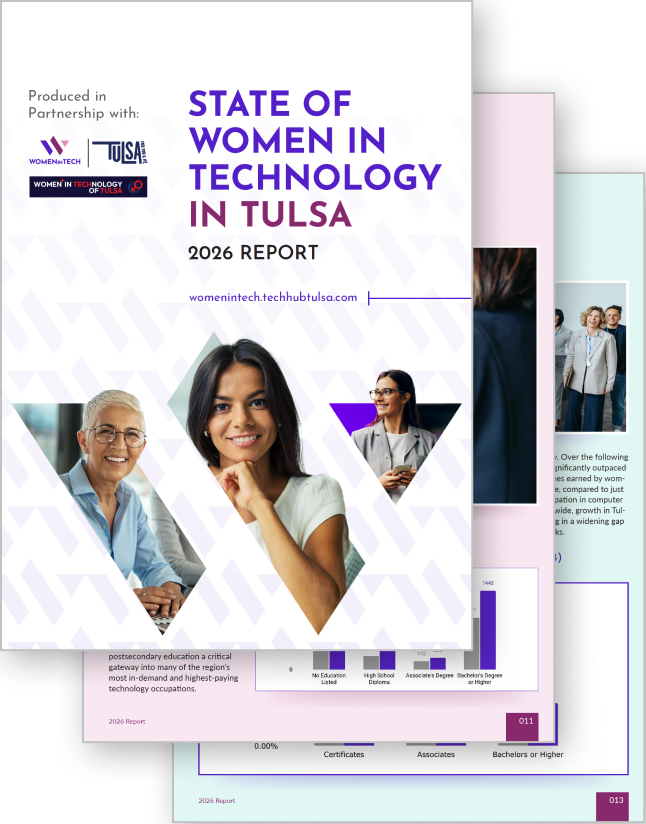
State of Women in Technology in Tulsa was produced in partnership with organizations committed to expanding opportunity and building a stronger technology workforce across the Tulsa region.
.svg)

.svg)
Oklahoma WomenInTech · 2026
Bureau of Labor Statistics Occupational Employment and Wage Statistics · Lightcast Analyst (2025.4 release)

Nile Dixon

Jake Cronin

Dajah Brooks

Claire Tomm

Valerie Feral

Addie Ventris
Nile Dixon
Jake Cronin
Dajah Brooks
Claire Tomm
Valerie Feral
Join us as we celebrate the release of the State of Women in Technology in Tulsa report.
Event Name
Tulsa Research Reveal

Chief Sensemaking Strategist